Table of Contents
Introduction: The Cost of Flying Blind
Your database server starts degrading at 2:47 AM on a Friday. By 3:15 AM, your e-commerce platform is returning timeout errors. By 4:00 AM, your on-call engineer—who had no alert because the threshold was set too high—wakes up to a full-scale outage and a flood of customer complaints. The incident is resolved by 7:30 AM. The revenue loss, SLA penalties, and reputational damage are not.
This scenario plays out in organizations of every size, across every industry. And in the vast majority of cases, it is preventable.
Server monitoring is not a “nice to have.” For any organization operating critical infrastructure—whether that is a financial services platform, a healthcare data system, a SaaS application, or a government network—comprehensive, real-time visibility into server health is an operational requirement. The right server monitoring tools do not just alert you when things break; they give you the intelligence to prevent failures, optimize capacity, satisfy compliance requirements, and accelerate mean time to resolution (MTTR) when incidents inevitably occur.
This article is written for infrastructure engineers, systems administrators, and IT operations leads who already understand the basics and need a serious, practical evaluation of the best server monitoring software available today. We will cover architecture, real-world deployment considerations, pricing models, and the nuances that vendor marketing materials never mention.
What “Critical Infrastructure Monitoring” Actually Demands
Before evaluating tools, it is worth establishing the baseline requirements that separate adequate monitoring from genuinely mission-critical observability.
Core Monitoring Dimensions
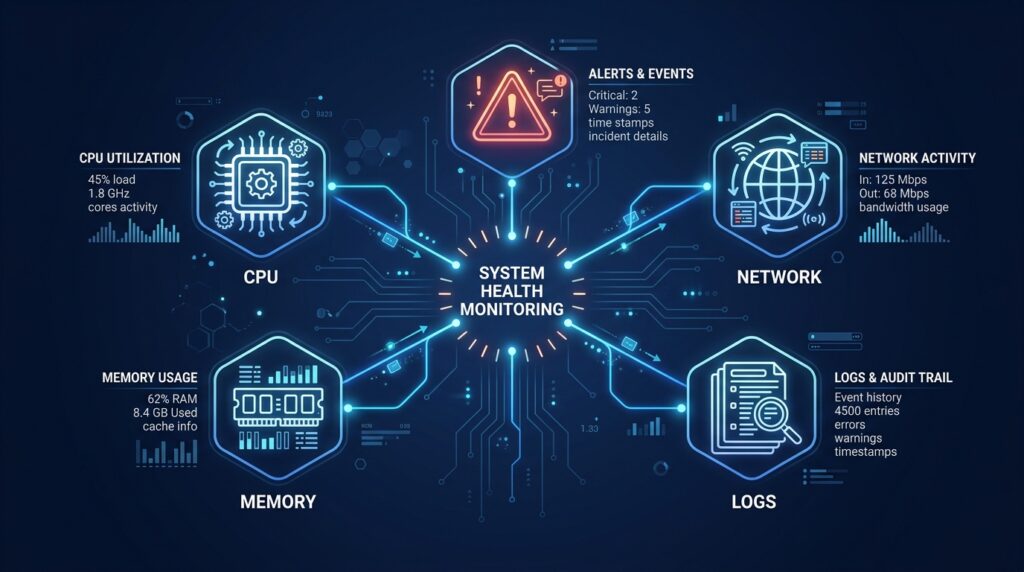
Any tool deployed in a critical environment must cover all four dimensions of infrastructure health:
- Availability monitoring: Is the server reachable? Is the service responding? Basic ICMP/TCP checks are the floor, not the ceiling.
- Performance monitoring: CPU utilization, memory consumption, disk I/O throughput, network bandwidth—tracked with sufficient granularity to detect degradation before it becomes failure.
- Log aggregation and correlation: System logs, application logs, and security logs must be centralized, parsed, and correlated with metric anomalies to reconstruct incident timelines accurately.
- Dependency mapping: In a microservices or hybrid environment, a server does not fail in isolation. Understanding upstream and downstream dependencies is essential for root cause analysis.
Standards and Frameworks Relevant to Monitoring
- ITIL v4 defines incident, problem, and change management processes that depend heavily on accurate monitoring data.
- NIST SP 800-137 (Information Security Continuous Monitoring) mandates ongoing visibility into security posture for federal and regulated environments.
- SOC 2 Type II and ISO/IEC 27001 both require demonstrable controls around system availability and incident logging.
- SRE (Site Reliability Engineering) principles from Google’s SRE book establish monitoring as foundational to SLO/SLA management.
Key Criteria for Evaluating Server Monitoring Tools
When evaluating server monitoring software for production use, apply the following framework consistently across all candidates:
1. Data Collection Architecture
- Agent-based vs. agentless vs. hybrid
- Protocol support: SNMP, WMI, SSH, REST APIs, JMX, IPMI
- Support for Windows Server, Linux distributions (RHEL, Debian, Ubuntu), and UNIX variants
2. Scalability and Performance Overhead
- How does the monitoring stack itself behave under load?
- What is the agent’s CPU/memory footprint on monitored hosts?
- Does the architecture support horizontal scaling of the collector layer?
3. Alerting Intelligence
- Static thresholds are a starting point, not a solution. Look for dynamic baselining, anomaly detection, and alert correlation to reduce noise.
- Escalation policy support: PagerDuty, OpsGenie, Slack, Microsoft Teams integrations.
4. Extensibility and Integration
- REST API access for CMDB integration, custom dashboards, or SOAR playbooks.
- Plugin or integration ecosystem depth.
5. Total Cost of Ownership (TCO)
- Licensing model: per-node, per-user, per-metric, or subscription tier.
- Hidden costs: professional services for deployment, ongoing tuning, storage for long-term retention.
6. Deployment Model Flexibility
- On-premises, SaaS, or hybrid.
- Air-gapped environment support for sensitive networks.
The Top 10 Server Monitoring Tools for Critical Infrastructure
1. SolarWinds Server & Application Monitor (SAM)
Best for: Large enterprise IT operations with heterogeneous Windows/Linux environments and existing SolarWinds Orion platform investment.
SolarWinds SAM remains one of the most operationally mature server monitoring tools in the enterprise space. Its strength lies in the depth of out-of-the-box application templates—covering everything from Microsoft Exchange and SQL Server to Apache and Oracle—combined with the Orion platform’s unified topology view.
What works in practice: When you are managing hundreds of servers across multiple data centers, SAM’s Application Monitor templates dramatically reduce initial deployment time. The correlation between application-layer metrics and underlying host performance is genuinely useful for rapid triage. The “AppInsight” modules for IIS, SQL Server, and Exchange provide database query-level and thread-pool visibility without requiring custom scripting.
Honest limitations: The Orion platform’s resource consumption on the polling engine is not trivial. At scale (thousands of nodes), you will need to architect a distributed polling topology with additional Polling Engines and Additional Web Servers. The UI, while feature-rich, carries the complexity debt of a platform that has grown significantly through acquisitions. The 2020 SUNBURST supply-chain attack—while resolved—is a legitimate consideration for security-conscious organizations that must be evaluated against current SolarWinds security posture documentation.
Deployment model: On-premises (Windows Server required for Orion) Licensing: Perpetual + maintenance or subscription; node-based pricing
2. PRTG Network Monitor (Paessler)
Best for: Mid-market IT teams that need broad infrastructure coverage—servers, network devices, applications, and sensors—under a single, unified interface without the complexity overhead of enterprise platforms.
PRTG’s sensor-based model is elegantly pragmatic. Every monitored metric—a CPU reading, an HTTP endpoint check, a disk volume—is an individual “sensor,” and licensing is based on sensor count. This granularity means you pay for what you actually monitor, though it requires careful capacity planning to avoid sensor budget overruns on large deployments.
What works in practice: PRTG’s out-of-the-box sensor library is one of the most comprehensive available. From SNMP OID polling to VMware vSphere monitoring to REST API JSON sensors, initial coverage of a mixed environment is achievable in hours rather than days. The auto-discovery engine is reliable and the map/dashboard builder is accessible to non-specialist staff.
Honest limitations: PRTG’s reporting engine is functional but not sophisticated. If your stakeholders demand executive-grade reporting or advanced trend analysis, you will likely supplement with an external tool. Scalability above ~10,000 sensors on a single probe server requires a distributed probe architecture that adds operational complexity.
Deployment model: On-premises (Windows) or PRTG Hosted Monitor (SaaS) Licensing: Sensor-based perpetual or subscription tiers (500, 1000, 2500, 5000, unlimited)
3. Datadog Infrastructure Monitoring
Best for: Cloud-native and DevOps-centric organizations running dynamic, containerized, or multi-cloud workloads where infrastructure and application observability must be unified.
Datadog has redefined what modern server monitoring software looks like. Its agent is lightweight, its auto-discovery for containers and Kubernetes is genuinely excellent, and its unified platform—covering infrastructure metrics, APM, log management, synthetic monitoring, and security—eliminates the context-switching overhead that plagues multi-tool observability stacks.
What works in practice: The Datadog Agent’s integration list is extensive, and most integrations require only YAML configuration changes rather than custom scripting. For organizations running Kubernetes, the Datadog Cluster Agent architecture handles metric collection at scale without overwhelming the API server. The built-in anomaly detection and forecast monitors reduce alert fatigue significantly compared to purely static threshold-based tools.
Honest limitations: Datadog’s pricing model is its most frequently cited operational challenge. Costs scale with both the number of hosts and the volume of custom metrics, and in large dynamic environments with high metric cardinality, bills can escalate significantly beyond initial estimates. Careful metric tagging governance and custom metric budgets are essential from day one. It is also a SaaS-only product, which disqualifies it for environments with strict data residency or air-gap requirements.
Deployment model: SaaS only Licensing: Per-host/per-product module subscription; custom metric pricing applies
4. Zabbix
Best for: Organizations that require enterprise-grade monitoring capability with open-source licensing, particularly in environments with strict data sovereignty requirements or significant budgetary constraints.
Zabbix is the open-source monitoring platform that consistently outperforms expectations. Its architecture—combining a server, database backend (MySQL/PostgreSQL/Oracle), and optional proxy layer—is genuinely scalable to tens of thousands of hosts with proper tuning. The template system, active community, and Zabbix-native integration APIs make it a serious enterprise choice, not just a budget option.
What works in practice: Zabbix’s low-level discovery (LLD) rules are a genuine force multiplier. Rather than manually defining monitoring items for each network interface, disk volume, or running process, LLD rules discover them dynamically and apply item prototypes automatically. For large fleets with heterogeneous configurations, this dramatically reduces configuration overhead. The Zabbix proxy architecture allows you to monitor remote sites or isolated networks while centralizing data at the Zabbix server.
Honest limitations: The TCO of Zabbix is not zero. While the software is free, the infrastructure to run it (database server, application servers at scale), the engineering time to deploy and maintain it, and the learning curve for non-specialists represent real costs. The out-of-the-box dashboards and maps require significant customization effort to produce business-ready visualizations. Zabbix also lacks native distributed tracing and APM capabilities, which may require supplementing with tools like Jaeger or Elastic APM.
Deployment model: On-premises (self-hosted); cloud deployments on any IaaS Licensing: Open-source (GPL v2); commercial support contracts available from Zabbix LLC
5. Nagios (Core & XI)
Best for: Organizations with existing Nagios investments, highly customized check ecosystems, and teams with strong Linux systems administration expertise.
Nagios Core is foundational to the history of open-source infrastructure monitoring. Its check plugin model—where any executable that returns a status code (0=OK, 1=WARNING, 2=CRITICAL) becomes a valid monitor—created an ecosystem of thousands of community-contributed plugins that covers almost any technology imaginable.
What works in practice: If you have a unique, proprietary system or application that no commercial tool supports out of the box, the Nagios plugin architecture makes it straightforward to write a custom check in any scripting language. The NRPE (Nagios Remote Plugin Executor) agent and NSCA (Nagios Service Check Acceptor) passive check system provide flexible collection architectures.
Nagios XI, the commercial version, adds a proper web GUI, configuration wizards, and reporting on top of the Core engine—making it significantly more accessible for operations teams without deep Linux expertise.
Honest limitations: Nagios Core’s configuration is entirely file-based and can become unwieldy at scale. There is no native support for modern distributed tracing, container monitoring, or dynamic service discovery that matches the experience of cloud-native tools. Alert management in the core product is basic compared to modern platforms. For greenfield deployments, Nagios is rarely the optimal first choice; its strength lies in augmenting existing environments.
Deployment model: On-premises (Linux); Nagios XI available as VM appliance Licensing: Core is open-source (GPL); XI is commercial per-instance
6. ManageEngine OpManager
Best for: IT teams in mid-enterprise environments that need comprehensive network and server monitoring with ITIL-aligned processes and tight integration with other ITSM tooling.
ManageEngine OpManager occupies a strong position in the mid-market by combining server monitoring, network device monitoring, and virtual infrastructure monitoring in a single product, with native integration into the broader ManageEngine suite (ServiceDesk Plus, ADManager, Applications Manager).
What works in practice: OpManager’s Business Views and network maps provide genuinely useful visualization for operations centers. The Workflow engine for automated remediation—automatically restarting a service, executing a script, or logging a ticket in ServiceDesk Plus when an alert fires—reduces the manual overhead of first-level response significantly. Integration with ManageEngine’s Applications Manager extends coverage into Java application servers (JBoss, WebSphere, WebLogic), databases, and middleware.
Honest limitations: OpManager’s licensing model can become complex in large environments with multiple add-ons (NCM, NFA, Storage, Applications Manager). Performance at very high node counts (above 1,000-2,000 devices) may require additional probes and architectural planning. The UI has improved significantly in recent versions but still carries some legacy design debt.
Deployment model: On-premises (Windows/Linux) or ManageEngine Cloud Licensing: Perpetual + annual maintenance or subscription; tiered by device count
7. Netdata
Best for: Infrastructure and DevOps teams that need per-second metric granularity, zero-configuration agent deployment, and open-source flexibility with a modern UI.
Netdata is the tool that genuinely surprises engineers when they first deploy it. The agent installs in under a minute, auto-discovers hundreds of data sources on the host, and immediately presents per-second metrics in a browser UI—no configuration required for the initial setup. This “time to first insight” is arguably the best in its class.
What works in practice: Netdata’s streaming and replication architecture allows you to configure parent-child relationships, where child agents stream real-time data to parent nodes and Netdata Cloud for centralized dashboarding. For high-cardinality environments (many short-lived containers), Netdata’s streaming model is more efficient than polling-based architectures. The metrics retention is configurable, and the Netdata Cloud tier adds cross-node correlation, alert management, and team features.
Honest limitations: Netdata is metrics-focused; it does not natively replace a SIEM, a log management platform, or a full APM solution. For complex enterprise reporting, compliance audit trails, or deep application-layer tracing, it needs to be part of a broader observability stack. The commercial Netdata Cloud tier is still maturing relative to more established SaaS platforms in terms of enterprise governance features.
Deployment model: Agent on-premises; Netdata Cloud (SaaS) for centralized management Licensing: Open-source (GPL v3) agent; Netdata Cloud has free and paid tiers
8. NinjaOne (formerly NinjaRMM)
Best for: Managed Service Providers (MSPs) and distributed enterprise IT teams that need unified Remote Monitoring and Management (RMM) with integrated endpoint management, patching, and backup.
NinjaOne approaches server monitoring from the RMM perspective, combining real-time monitoring with the operational tooling that IT operations and MSP teams need to act on what they observe. It is not purely a metrics platform—it is an operational platform where monitoring drives automated remediation and technician workflows.
What works in practice: NinjaOne’s Policy Engine allows you to define monitoring profiles, alert conditions, and automated scripting responses that are applied to device groups automatically. When a disk health S.M.A.R.T. alert fires, a NinjaOne policy can automatically run a diagnostic script, log the result, and create a ticket—all without human intervention. For MSPs managing multiple client environments, the multi-tenant architecture with role-based access control is production-grade.
Honest limitations: NinjaOne is not a deep infrastructure observability platform. If you need granular network flow analysis, custom SNMP OID polling across hundreds of device types, or advanced time-series analytics, it is not the right primary tool. Its strength is operational efficiency in IT management workflows, not raw monitoring depth.
Deployment model: SaaS Licensing: Per-device subscription; pricing negotiated per contract
9. Prometheus + Grafana (Open-Source Stack)
Best for: Engineering-led organizations running cloud-native, containerized workloads that require maximum flexibility, deep Kubernetes integration, and are willing to invest in building and operating the stack.
The Prometheus + Grafana combination has become the de facto observability standard in cloud-native environments. Prometheus is a time-series database and collection engine that uses a pull model and a powerful query language (PromQL). Grafana provides the visualization and alerting layer. Together, they form the backbone of many production observability platforms.
What works in practice: The Kubernetes ecosystem is built around Prometheus. The kube-state-metrics exporter and node_exporter provide comprehensive cluster and node-level visibility. The Prometheus Operator (part of the kube-prometheus-stack Helm chart) automates the deployment and management of Prometheus instances in Kubernetes. AlertManager handles routing, grouping, and deduplication of alerts with considerable flexibility.
Honest limitations: Operating Prometheus at scale—high cardinality metrics, long-term retention, high availability—requires significant engineering investment. Native Prometheus is not designed for multi-tenancy or long-term metric storage at enterprise scale; production deployments commonly introduce Thanos or Cortex/Mimir for these requirements. This is not a tool you deploy and forget; it requires active maintenance and PromQL expertise.
Deployment model: Self-hosted (any Linux/container environment); managed offerings via Grafana Cloud Licensing: Open-source (Apache 2.0); Grafana Cloud and Grafana Enterprise are commercial
10. Elastic Observability (ELK Stack)
Best for: Organizations that need unified logs, metrics, and traces under a single query interface, particularly where log analysis is a primary workflow and deep search capability is required.
Elastic Observability extends the well-known Elasticsearch/Logstash/Kibana stack into a full observability platform by adding Elastic APM, the Elastic Agent (which supersedes Beats agents), and infrastructure metrics collection. The unified query language (ES|QL and KQL) across logs, metrics, and traces is a significant operational advantage for complex investigations.
What works in practice: When correlating a performance degradation with application logs and infrastructure metrics simultaneously, Elastic’s unified timeline and correlated data model produces faster root cause analysis than platforms that store these data types separately. The Fleet management system for Elastic Agent deployments simplifies agent lifecycle management across large fleets. Elasticsearch’s full-text search capability on log data is unmatched for forensic analysis.
Honest limitations: Elasticsearch is resource-intensive. Cluster sizing for high log ingestion volumes requires careful planning, and the operational complexity of managing an Elasticsearch cluster—shard management, index lifecycle policies, cluster health—should not be underestimated. Elastic Cloud (the managed SaaS offering) significantly reduces this burden but introduces cost considerations at scale.
Deployment model: Self-hosted or Elastic Cloud (SaaS) Licensing: Open-source core (ELastic License 2.0 / SSPL); Elastic Cloud and enterprise features are commercial
Comparative Analysis: Server Monitoring Tools at a Glance
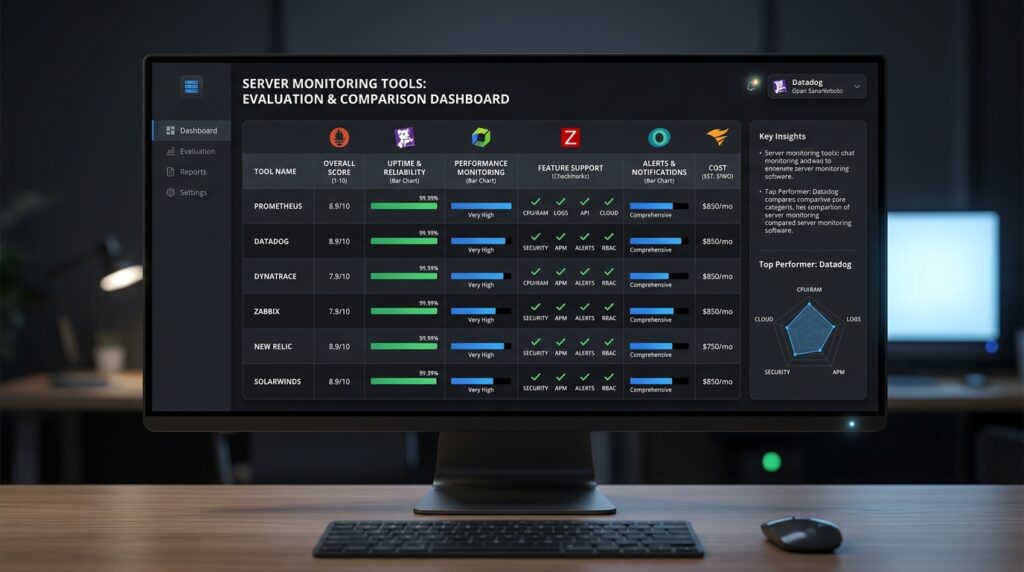
| Tool | Type | Deployment | Cloud-Native Support | Open Source | Starting Price (USD) | Best Fit |
|---|---|---|---|---|---|---|
| SolarWinds SAM | Commercial | On-Prem | Partial (hybrid) | No | ~$1,663/yr (per license) | Large enterprise, Windows-centric |
| PRTG Network Monitor | Commercial | On-Prem / SaaS | Partial | No | ~$2,149/yr (500 sensors) | Mid-market, mixed infra |
| Datadog | Commercial SaaS | SaaS only | Excellent (cloud-native) | No | ~$15–23/host/month | Cloud-native, DevOps teams |
| Zabbix | Open Source | Self-hosted | Good (with extensions) | Yes (GPL v2) | Free (infra costs apply) | Budget-conscious enterprise |
| Nagios Core / XI | Open Source / Commercial | On-Prem | Limited | Core: Yes (GPL) | Core: Free / XI: ~$2,495 | Custom check ecosystems |
| ManageEngine OpManager | Commercial | On-Prem / Cloud | Moderate | No | ~$245/yr (10 devices) | Mid-enterprise, ITSM-integrated |
| Netdata | Open Source / Freemium | Agent + Cloud | Good | Yes (GPL v3) | Free / Cloud from ~$0–custom | Per-second metrics, lean teams |
| NinjaOne | Commercial SaaS | SaaS | Moderate (RMM-focused) | No | Custom (per device/contract) | MSPs, distributed IT ops |
| Prometheus + Grafana | Open Source | Self-hosted / Cloud | Excellent (K8s native) | Yes (Apache 2.0) | Free (infra + engineering) | Engineering-led, cloud-native |
| Elastic Observability | Open Source / Commercial | Self-hosted / Cloud | Excellent | Core: Yes | Free / Elastic Cloud from ~$95/mo | Log-heavy, unified observability |
Notes:
- Pricing reflects publicly available information and is subject to change; always request a vendor quote for accurate current pricing.
- “Cloud-Native Support” refers to Kubernetes, container auto-discovery, and dynamic environment monitoring capability.
- Open-source tools have $0 licensing cost but non-zero TCO due to infrastructure, staffing, and operational overhead.
Cloud Server Monitoring: Visibility in Dynamic Environments

Cloud server monitoring introduces challenges that traditional on-premises monitoring approaches are fundamentally not designed to handle:
The Ephemeral Infrastructure Problem
In cloud environments—whether AWS EC2 Auto Scaling Groups, Azure VM Scale Sets, or GCP Managed Instance Groups—servers are created and destroyed dynamically. A monitoring tool that requires manual node registration or static configuration is operationally untenable in these environments. Auto-discovery and tag-based grouping are not optional features; they are baseline requirements.
Multi-Cloud Visibility
Organizations running workloads across AWS, Azure, and GCP simultaneously need monitoring solutions that provide a unified operational view rather than requiring engineers to switch between native cloud consoles. Key capabilities for multi-cloud server monitoring software include:
- Native cloud integration: Direct API integration with CloudWatch (AWS), Azure Monitor, and Google Cloud Monitoring to correlate cloud-managed service metrics with instance-level metrics.
- Consistent tagging taxonomy: Enforcing consistent resource tagging across cloud providers is essential for accurate cost attribution, alert routing, and performance grouping.
- Cloud Cost + Performance correlation: Understanding the relationship between resource utilization and cloud spend is a monitoring capability that pure metrics tools lack but platforms like Datadog, Elastic, and Dynatrace increasingly provide.
Recommended Approaches for Cloud Server Monitoring
| Cloud Environment | Recommended Approach |
|---|---|
| AWS-primary | Datadog, CloudWatch + Grafana, Elastic Agent |
| Azure-primary | Azure Monitor + Log Analytics, Datadog, PRTG |
| GCP-primary | Cloud Operations Suite + Prometheus, Datadog |
| Multi-cloud/hybrid | Datadog, Elastic Observability, Prometheus + Thanos |
| Air-gapped/on-prem | Zabbix, PRTG, SolarWinds SAM, Nagios XI |
Server and Application Monitor: Beyond the OS Layer
Infrastructure monitoring without application performance visibility produces an incomplete operational picture. The server and application monitor category bridges the gap between OS-level metrics (CPU, memory, disk) and application-layer behavior (response times, error rates, transaction throughput, database query latency).
Why Application-Layer Monitoring Matters
Consider a scenario where a web application server shows normal CPU and memory utilization, but users are experiencing slow page loads. Without application instrumentation, the monitoring platform offers no insight. With proper server and application monitoring in place:
- APM agents (Datadog APM, Elastic APM, New Relic) instrument the application runtime to capture per-transaction latency, slow database queries, and external service call performance.
- Synthetic monitoring proactively simulates user transactions from external vantage points, detecting issues before real users are affected.
- Log correlation ties application error logs to specific performance degradation events, enabling root cause analysis without requiring manual log triage.
The Golden Signals Framework
Google’s SRE discipline introduced the Four Golden Signals as the minimum viable monitoring model for any service:
- Latency – How long does it take to serve a request?
- Traffic – What is the demand on the system?
- Errors – What is the rate of failing requests?
- Saturation – How “full” is the service? Which resource is the constraint?
A server and application monitor that cannot instrument all four of these signals for your critical services is not a complete solution.
Tools with Strong Server + Application Monitoring Capability
- SolarWinds SAM + APM: AppInsight modules provide application-layer depth for Microsoft stack environments.
- Datadog: Best-in-class unified infra + APM integration; trace-to-metric correlation is production-grade.
- Elastic Observability: Unifies logs, metrics, and traces; strong for Java, .NET, Node.js applications via Elastic APM agents.
- ManageEngine Applications Manager: Specializes in Java application servers, databases, and middleware monitoring.
- Zabbix + external APM: Zabbix handles infra; pair with Elastic APM or Jaeger for distributed tracing.
Expert Insights: What Vendor Documentation Will Never Tell You

These are the observations that only emerge after years of deploying, tuning, and failing with monitoring platforms in production:
1. Alert Fatigue is a Monitoring Architecture Failure
The single most common monitoring dysfunction in production environments is an alert queue that nobody trusts. When engineers receive hundreds of alerts per shift—many of which are noise, flapping, or duplicate—they stop responding with urgency. Alert fatigue is not a people problem; it is a system design problem.
The fix: Implement alert grouping, inhibition rules (suppress downstream alerts when a root cause alert is active), and aggressive hysteresis (require a condition to persist for N minutes before alerting). Tools like Prometheus AlertManager, PagerDuty’s alert grouping, and Datadog’s composite monitors provide these mechanisms. Use them.
2. Your Monitoring Tool’s Own Health is Not Monitored
It is a cliché because it is true: the monitoring system is rarely monitored itself. In practice, define watchdog checks—external monitors that verify your primary monitoring platform is functional. If your Zabbix server goes silent, you need to know within minutes, not when someone notices missing dashboards.
3. Disk Capacity Alerts Set to 90% Are Already Too Late
In high-throughput environments (busy databases, log servers, CI/CD build hosts), disk utilization can go from 85% to 100% within minutes under the right workload conditions. Production-grade alerting should use rate-of-change metrics alongside static thresholds: alert when disk is filling at a rate that projects exhaustion within a defined window.
4. Baselines Beat Static Thresholds at Scale
Static CPU alerts (e.g., alert when CPU > 80%) generate enormous noise in environments with predictable load patterns—batch jobs, end-of-month processing, market-hours trading spikes. Dynamic baselining (available natively in Datadog, available via Zabbix’s predictive triggers and PRTG’s unusual detection sensors) alerts on deviation from learned normal behavior, dramatically improving signal-to-noise ratio.
5. Monitoring Data is Evidence—Treat It as Such
In regulated environments (PCI-DSS, HIPAA, SOC 2), monitoring logs and metric data are not just operational tools—they are audit evidence. Ensure your monitoring platform’s data retention policies align with your compliance obligations. This means defining long-term metric storage (1-2+ years in some frameworks), tamper-evident log storage, and access audit trails for the monitoring system itself.
6. Test Your Alerting Regularly with Controlled Failures
An alert that has never fired in a meaningful incident has an unknown reliability profile. Conduct regular GameDay exercises or chaos engineering experiments (using tools like Netflix’s Chaos Monkey or AWS Fault Injection Simulator) to validate that alerts fire correctly, escalation paths work, and runbooks are accurate.
Frequently Asked Questions
Q1: What is the best server monitoring tool for a small-to-mid-size enterprise with limited budget?
Zabbix and Netdata are the strongest options for budget-constrained environments. Zabbix provides enterprise-grade capability at $0 licensing cost but requires Linux/database expertise to deploy and maintain. Netdata offers the fastest time to initial visibility with minimal configuration overhead, and the free Netdata Cloud tier covers most SME use cases. If your team has Windows-centric skills and limited Linux expertise, PRTG’s free tier (up to 100 sensors) is a functional entry point.
Q2: Can server monitoring tools also monitor cloud services like AWS RDS, Azure SQL, or GCP Pub/Sub?
Yes, but capability varies significantly by tool. Datadog has the broadest native integration coverage for cloud-managed services, collecting metrics directly via cloud provider APIs without requiring agents on managed services. Elastic Agent and Prometheus with cloud exporters support most major cloud service APIs. Zabbix supports cloud service monitoring via HTTP agent items and custom scripts, but requires more configuration effort. PRTG and SolarWinds SAM have AWS and Azure integrations but vary in depth for specific managed services.
Q3: What is the difference between server monitoring and network monitoring?
Server monitoring focuses on the health and performance of the host system itself: OS-level metrics (CPU, memory, disk), running processes, services, application performance, and logs. Network monitoring focuses on the behavior of network infrastructure: switch/router performance, interface utilization, packet loss, latency between nodes, BGP/OSPF routing health, and network flow analysis. In practice, the boundary overlaps—tools like PRTG, OpManager, and SolarWinds monitor both. For pure network visibility, purpose-built tools like LibreNMS, Kentik, or SolarWinds NTA provide deeper capability.
Q4: Is agent-based or agentless monitoring better for critical servers?
This is a context-dependent decision, not a universal answer. Agent-based monitoring provides richer, more granular data (process-level metrics, custom application checks, log forwarding) and is more reliable in noisy network environments. The trade-off is agent deployment, versioning, and maintenance overhead. Agentless monitoring (SNMP, WMI, SSH-based) is easier to deploy for initial coverage and does not require installation on every host, but is typically limited to OS-level metrics and depends on network accessibility.
The operational best practice for critical infrastructure is a hybrid model: lightweight agents on servers for deep metrics and log collection, supplemented by agentless SNMP/ICMP polling for network devices and systems where agent installation is restricted.
Q5: How many server monitoring tools does an organization typically need?
More is not better. The goal is maximum coverage with minimum tool sprawl. Every additional monitoring platform introduces integration overhead, data silos, and training burden. The pragmatic answer for most mid-to-large organizations is:
- One primary infrastructure monitoring platform (Zabbix, PRTG, SolarWinds SAM, or similar)
- One observability/APM platform for application-layer visibility (Datadog, Elastic, or Prometheus stack)
- One SIEM for log aggregation and security correlation (Elastic Security, Splunk, Microsoft Sentinel)
- One synthetic monitoring tool for external availability validation (Datadog Synthetics, Pingdom, or similar)
The key is ensuring these platforms exchange data through APIs and that alerts flow to a unified incident management system (PagerDuty, OpsGenie, or similar).
Conclusion: Choose the Tool That Fits the Threat
The best server monitoring tool is not the one with the longest feature list or the most impressive vendor demo. It is the one that your team will actually configure correctly, tune intelligently, and act on consistently when it fires at 2:47 AM.
Before selecting any platform from this guide, answer these three questions with rigorous honesty:
- What is the technical profile of the team that will own this tool? An enterprise platform deployed without the expertise to tune it is worse than a simpler tool deployed well.
- What is the primary failure mode you are trying to prevent? A compliance-driven organization in a regulated industry has different monitoring priorities than a startup optimizing for deployment velocity.
- What does your environment actually look like today—and in 18 months? A monitoring architecture designed for a static on-premises environment will need to be rebuilt for a hybrid or cloud-first future.
The tools reviewed in this guide represent the current state of the art across the full spectrum of organizational profiles and budget envelopes. Whether you deploy Zabbix on bare metal, instrument your Kubernetes cluster with the Prometheus stack, or move to Datadog for unified cloud observability, the principle remains constant: visibility is the prerequisite for everything else.
Invest in it accordingly.
This article reflects operational experience with server monitoring platforms in production environments. Pricing and product features are subject to change; always validate current specifications with vendors before procurement decisions. For specific compliance requirements (SOC 2, HIPAA, PCI-DSS), consult the vendor’s compliance documentation and engage a qualified security assessor.