How to Measure the ROI of Tech Investments (Without a Data Science Degree)
Admin
1 June, 2026
Last year, a manufacturing company with 85 employees signed a $48,000 annual contract for a CRM platform. Twelve months later, only nine people logged in regularly. The sales team kept their leads in spreadsheets. Customer service still relied on sticky notes and Outlook folders. The CFO found out about the adoption problem during budget season — when the vendor sent the renewal invoice.
That $48,000 didn’t just vanish. It also dragged down 140+ hours of implementation work, a consultant’s fee, and the morale of a team that was told “this will change everything.” The total cost was closer to $70,000 for a tool that changed nothing.
If this sounds familiar — or even close to familiar — you’re not alone. And the problem isn’t that the technology was bad. The problem is that nobody defined what “working” looked like before they bought it.
This article gives you the exact framework to fix that. No dashboards full of vanity metrics. No abstract talk about “digital transformation.” Just the math.
The Real Cost of Not Measuring (Or Measuring the Wrong Things)
Most businesses track the wrong numbers after a tech purchase. They look at adoption rates, login frequency, or tickets resolved. Those numbers feel productive. They fill up quarterly reports nicely. But they tell you almost nothing about whether the investment actually returned money to the business.
Here’s the distinction that matters:
Vanity Tech Metrics
True Financial ROI Indicators
Number of users who logged in this month
Revenue generated per user of the platform
Total tickets closed in the helpdesk system
Average cost-per-ticket before vs. after implementation
“We automated 500 tasks”
Hours recovered × average fully loaded hourly wage
Customer satisfaction score went up 4%
Customer retention rate change × average customer lifetime value
99.9% system uptime
Downtime cost avoided (lost revenue per hour × hours saved)
“The team loves the new tool”
Error rate reduction × average cost per error
The Three Buckets of Tech ROI
Every technology investment produces value (or doesn’t) in three measurable ways. You don’t need a data team to calculate them. You need a calculator, access to your payroll data, and an honest conversation with the people who use the tool.
Bucket 1: Direct Cost Savings
This is the simplest one. Did the software replace something you were already paying for?
Formula:
Direct Cost Savings = (Old cost per year) − (New cost per year, fully loaded)
“Fully loaded” is the key phrase. The sticker price of your new SaaS tool is not its real cost. You need to include:
Annual license or subscription fees
Implementation and onboarding costs (amortized over the contract length)
Internal IT time spent on setup, maintenance, and troubleshooting
Training costs (hours spent × fully loaded wage of every person trained)
Any integration or middleware costs to connect it to your existing systems
A company that replaced a $30,000/year on-premise accounting system with a $15,000/year cloud platform didn’t save $15,000. If they spent $12,000 on migration, $6,000 on training across the finance team, and $3,600/year on a middleware connector — their first-year cost was $36,600. They spent more in year one. The savings don’t start until year two, and only if the middleware and training costs don’t recur.
This is where most tech investments are supposed to shine — and where most CFOs lose the thread. “Saving time” is not an ROI metric. Saving time that gets redirected to revenue-generating work is.
Formula:
Efficiency Value = (Hours saved per week) × (Fully loaded hourly cost) × 52
Your fully loaded hourly cost isn’t the employee’s salary divided by 2,080 hours. It includes benefits, payroll taxes, equipment, office space allocation — typically between 1.25x and 1.5x the base hourly rate, depending on your industry and location. Your finance team can give you the exact multiplier for your company.
Here’s where it gets honest: if your accounts payable clerk saves 6 hours a week because of an automation tool, but spends those 6 hours browsing the internet or doing low-value busywork, you recovered zero dollars. Hours saved only count if they’re redeployed to work that either generates revenue or eliminates the need for a hire you would have otherwise made.
Ask the question: “What did we do with the time we got back?” If the answer is vague, the ROI is vague.
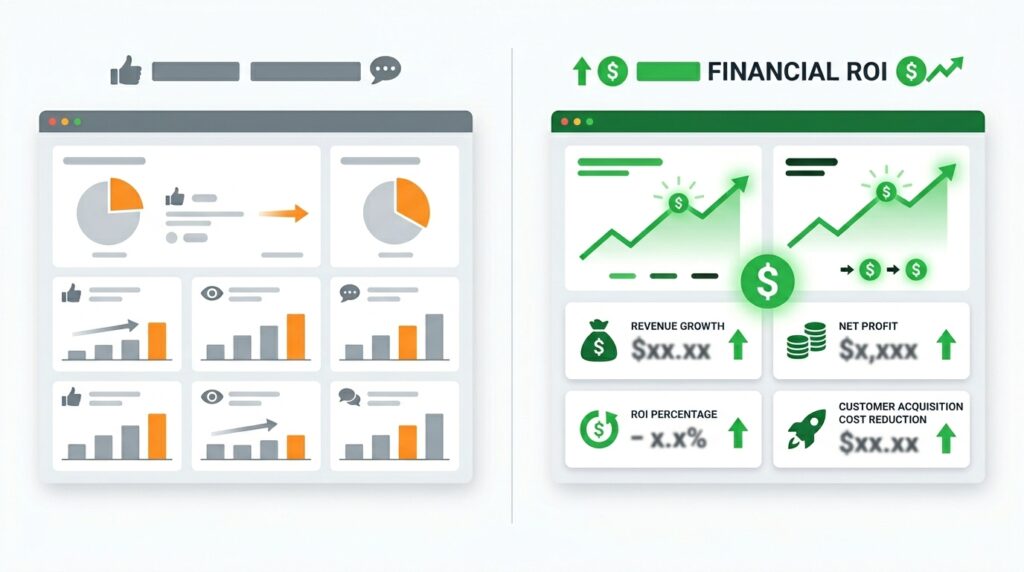
[INSERT IMAGE HERE: Financial Analytics and ROI Dashboard]
Bucket 3: Error Rate Reduction
This one is underappreciated and often worth more than the other two buckets combined. Every manual process has an error rate. Data entry mistakes, missed invoices, wrong shipments, compliance violations — they all carry real costs.
Formula:
Error Reduction Value = (Old error rate − New error rate) × (Volume of transactions) × (Average cost per error)
The average cost per error varies wildly. A data entry mistake in a spreadsheet might cost $20 to fix. A compliance violation in a regulated industry could cost six figures. A wrong shipment might cost the price of the product, the return shipping, the replacement, and the customer relationship.
If your old process produced errors on 4% of invoices and the new system brought that down to 0.5%, and you process 10,000 invoices per year at an average error cost of $35, that’s:
(0.04 − 0.005) × 10,000 × $35 = $12,250/year in recovered value
The Master ROI Formula
Once you’ve calculated all three buckets, the total ROI is straightforward:
Tech ROI (%) = [(Direct Cost Savings + Efficiency Value + Error Reduction Value) − Total Investment Cost] / Total Investment Cost × 100
If your total investment (fully loaded, including every hidden cost) was $60,000 and your three buckets add up to $85,000 in measurable value, your ROI is:
($85,000 − $60,000) / $60,000 × 100 = 41.6%
That’s a number you can take to a board meeting. That’s a number that tells you whether to renew, expand, or cut.
Download the free ROI calculator for Excel It includes the 3 formulas from the article pre-loaded with sample data. Simply replace them with your actual numbers and get your ROI, payback period, and renewal decision in seconds.
How to Run This Calculation When You Don’t Have Clean Data
Here’s the part nobody talks about at the conference keynotes: most SMEs don’t have pristine before-and-after data. You probably didn’t run a time study before implementing your last software purchase. You might not know your historical error rate down to two decimal places.
That’s fine. Use reasonable estimates and be transparent about your confidence level.
For hours recovered: Ask the five people who use the tool most. Don’t ask “how much time does this save you?” — people exaggerate. Instead ask: “Walk me through what you did last Tuesday. What would that have looked like a year ago?” Compare the two workflows step by step. Multiply by a conservative factor (use 70% of what people claim to account for optimism bias).
For error rates: Pull a sample. Look at 100 transactions from before the implementation and 100 from after. Count the errors. That’s your estimate. It won’t be perfect. It’ll be close enough.
For cost per error: Ask your operations team what happens when an error occurs. What’s the rework? The refund? The customer call? The compliance paperwork? Add it up for a handful of real examples and take the average.
A rough calculation based on honest estimates is infinitely more useful than no calculation at all.
The Payback Period: When the Money Comes Back
ROI tells you the return. Payback period tells you when you break even.
Formula:
Payback Period (months) = Total Investment Cost / (Monthly value from all three buckets)
If you invested $60,000 and your monthly value across all buckets is $7,083 ($85,000 ÷ 12), your payback period is about 8.5 months.
Most B2B software investments should pay for themselves within 12 to 18 months. If your payback period stretches beyond 24 months, you need to seriously question either the investment itself or the implementation approach.
A Quick Pre-Purchase Checklist
Before signing your next software contract, answer these questions in writing. Not in a meeting. In a document that someone will actually review at the renewal date.
1. What specific cost are we eliminating or reducing? Name the line item. Not “we’ll be more efficient.” What invoice goes away? What headcount do we avoid?
2. What is the measurable before-state? How many hours does this process take today? What is the current error rate? What is the current cost? If you can’t answer these, you can’t measure improvement later.
3. Who will use this tool and how often? If the answer is “everyone, once it’s rolled out,” you’re in trouble. Be specific. Name the roles, the use cases, the weekly frequency.
4. What does success look like at 90 days? Define it in numbers. “The AP team processes invoices in 4 minutes instead of 11” is a real target. “The team has adopted the new platform” is not.
5. What is our walk-away number? At what point is this investment not worth renewing? Decide that now, while you’re rational, not during a renewal negotiation with a salesperson offering you a “loyalty discount.”
The Bottom Line (Literally)
Measuring tech ROI isn’t complicated. It’s just uncomfortable. It forces you to admit that the shiny platform your team was excited about might not be pulling its weight. It forces vendors to justify their pricing with outcomes, not features. And it forces leadership to treat software budgets with the same rigor they apply to hiring or capital equipment.
The three-bucket framework — direct savings, hours recovered, error reduction — covers the vast majority of B2B software investments. The formulas aren’t sophisticated. The hard part is getting honest inputs.
Start with your most expensive software subscription. Run the numbers this week. You might find it’s your best investment. You might find it’s your worst. Either way, you’ll know — and that’s worth more than any dashboard.