Table of Contents
If you’ve ever SSH’d into a server mid-incident and found yourself running top, vmstat, iostat, and netstat in four different terminals just to get a basic picture of what’s going wrong — you already understand the problem Netdata solves.
Netdata is an open-source, real-time infrastructure monitoring tool built specifically for Linux environments. It collects thousands of metrics per second, renders them in interactive dashboards immediately after installation, and does all of this with a resource footprint that won’t become part of the problem you’re trying to debug.
This guide covers everything from a first install on Ubuntu or Debian to configuring custom alerts, connecting to Netdata Cloud, and understanding which metrics actually matter in production.
What Is Netdata and Why Do Linux Admins Use It

Netdata is a monitoring agent that runs directly on each Linux node and processes metrics locally — no central collection server required, no data leaving your infrastructure by default. It was accepted into the Cloud Native Computing Foundation (CNCF) as a sandbox project, which tells you something about where it sits in the broader ecosystem.
The numbers that make Netdata stand out technically:
- Per-second metric collection with sub-2-second latency — most traditional tools sample every 10 or 60 seconds, which means a CPU spike that lasts 8 seconds is completely invisible
- 5,000+ metrics collected per node out of the box, covering CPU, memory, disk I/O, network, processes, system calls, and application-layer metrics for hundreds of services
- 36% less CPU usage and 88% less RAM compared to centralized monitoring stacks, according to a 2023 University of Amsterdam study published at ICSOC (doi.org/10.1007/978-3-031-48421-6_14)
- 800+ integrations that auto-configure the moment a service is detected — no plugin configuration required for common stacks like NGINX, PostgreSQL, Redis, Docker, or Kubernetes
This is why sysadmins and DevOps engineers who’ve used both Netdata and something like a Prometheus + Grafana stack often describe Netdata as “ready to use in 60 seconds” while acknowledging that Prometheus gives you more query flexibility for custom metrics once you’ve invested the setup time.
Netdata vs Prometheus vs Datadog: Where Each Tool Fits
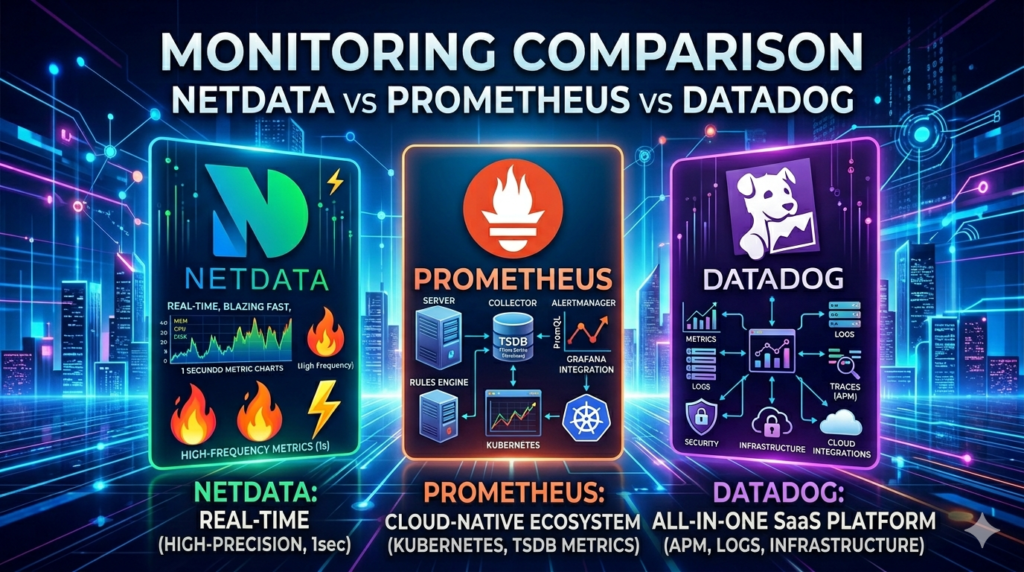
Before installing anything, it’s worth knowing where Netdata fits relative to the tools you might already be using.
| Netdata | Prometheus + Grafana | Datadog | |
|---|---|---|---|
| Setup time to first dashboard | ~60 seconds | Hours to days | Minutes (agent), hours (full config) |
| Data collection granularity | 1 second | Typically 15–60 seconds | Configurable, typically 15 seconds |
| Resource usage on monitored node | Very low | Low (Prometheus) + moderate (exporters) | Moderate to high |
| Custom metric queries | Limited (Metrics Correlations) | Powerful (PromQL) | Powerful (custom dashboards) |
| Long-term retention | Configurable (tiered storage) | Requires Thanos/Cortex for scale | Managed, 15 months default |
| Pricing for 10 nodes | Free (Community) | Free (self-hosted infra cost) | ~$180–360/month |
| Best for | Real-time troubleshooting, quick visibility | Custom observability stacks | Enterprise APM + infra |
The honest summary: Netdata excels at real-time visibility with minimal setup and minimal overhead. It’s not trying to replace Prometheus for teams who need PromQL-driven alerting pipelines or Datadog for full APM traces. Many teams run Netdata alongside Prometheus — Netdata for the immediate “what is happening right now” view, Prometheus for historical trend analysis and complex alerting rules.
System Requirements
Netdata runs on any modern Linux distribution. The agent is lightweight enough that it runs comfortably on a $5/month VPS.
Minimum requirements:
- Linux kernel 3.10+
- 1 CPU core (the agent typically uses 1–3% CPU)
- 100–200 MB RAM (higher if you enable ML anomaly detection)
- 1 GB disk space for metric storage (default 1-hour high-resolution + tiered long-term)
Officially supported distributions include:
- Ubuntu 20.04, 22.04, 24.04 (LTS recommended)
- Debian 10, 11, 12
- CentOS/RHEL/AlmaLinux/Rocky Linux 7, 8, 9
- Fedora (recent releases)
- Arch Linux
- macOS (limited, primarily for development)
- Docker and Kubernetes
How to Install Netdata on Ubuntu and Debian

Method 1: Kickstart Script (Recommended)
The official kickstart script is the fastest path to a working install. It detects your distribution, installs the correct package, enables the service, and starts collection immediately. (Source: Netdata)
bash
wget -O /tmp/netdata-kickstart.sh https://get.netdata.cloud/kickstart.sh
sh /tmp/netdata-kickstart.sh
If you prefer to inspect the script before running it (a reasonable instinct for production systems):
bash
wget -O /tmp/netdata-kickstart.sh https://get.netdata.cloud/kickstart.sh
less /tmp/netdata-kickstart.sh
# Review, then run:
sh /tmp/netdata-kickstart.sh
After installation completes, the agent starts automatically. Access your dashboard at:
http://your-server-ip:19999If you’re on a server with a firewall (ufw on Ubuntu), open the port for local access:
bash
sudo ufw allow from 192.168.0.0/16 to any port 19999Production note: Don’t expose port 19999 publicly. Either use Netdata Cloud (covered below), an nginx reverse proxy with authentication, or access via SSH tunnel:
ssh -L 19999:localhost:19999 user@your-server, then openhttp://localhost:19999locally.
Method 2: Native Package Manager on Ubuntu/Debian
For environments where running external scripts is restricted, Netdata maintains official APT repositories.
bash
# Add the Netdata GPG key
curl -fsSL https://packagecloud.io/netdata/netdata/gpgkey | sudo gpg --dearmor -o /usr/share/keyrings/netdata.gpg

# Add the repository
echo "deb [signed-by=/usr/share/keyrings/netdata.gpg] https://packagecloud.io/netdata/netdata/ubuntu/ $(lsb_release -cs) main" \
  | sudo tee /etc/apt/sources.list.d/netdata.list

# Install
sudo apt update && sudo apt install netdata -y
Method 3: Docker
If you’re monitoring a Docker host and want the agent containerized:
bash
docker run -d --name=netdata \
  --pid=host \
  --network=host \
  -v netdataconfig:/etc/netdata \
  -v netdatalib:/var/lib/netdata \
  -v netdatacache:/var/cache/netdata \
  -v /:/host/root:ro,rslave \
  -v /etc/passwd:/host/etc/passwd:ro \
  -v /etc/group:/host/etc/group:ro \
  -v /etc/localtime:/etc/localtime:ro \
  -v /proc:/host/proc:ro \
  -v /sys:/host/sys:ro \
  -v /etc/os-release:/host/etc/os-release:ro \
  --restart unless-stopped \
  --cap-add SYS_PTRACE \
  --security-opt apparmor=unconfined \
  netdata/netdata
The /host/root, /proc, and /sys volume mounts are what give the containerized agent access to actual host metrics rather than just container-level data.
Verifying the Installation
bash
# Check the service status
sudo systemctl status netdata

# Confirm it's listening
ss -tlnp | grep 19999

# Check agent version
netdata -v
A healthy output from systemctl status netdata should show active (running). If the service fails to start, check logs:
bash
sudo journalctl -u netdata -n 50 --no-pagerCommon issues on fresh Ubuntu installs:
- Port already in use: Another service on 19999 (rare but happens). Change Netdata’s port in
/etc/netdata/netdata.confunder[web]→port. - Permission errors on /proc: Usually means the agent user needs to be added to the correct groups. The installer handles this, but a manual install might miss it.
Netdata Linux: Understanding the Default Dashboard
Once you open http://your-server-ip:19999, you’ll see an auto-generated dashboard. It’s a lot of data at once. Here’s what to look at first.
System Overview
The top-level charts cover:
CPU — The most important chart is system.cpu, broken into dimensions: user, system, iowait, softirq, steal. High iowait tells you disk or network is blocking processes. High steal on a VPS means your host is overcommitting resources to other tenants.
Memory — system.ram shows used, cached, buffers, and free memory. High used with low cached is more concerning than high total consumption, since Linux aggressively uses free RAM for cache.
Disk I/O — disk.io per disk device. Sustained 100% utilization on a disk (disk.util) is a real warning sign; occasional spikes are normal.
Network — net.eth0 (or your interface name) shows receive and transmit rates. Pair this with net.drops — consistent packet drops indicate interface saturation or driver issues.
Application-Specific Metrics
If Netdata detects running services, it auto-creates sections for them in the dashboard. For example, if NGINX is running, you’ll see nginx.requests, nginx.connections_status, and nginx.connect_rate automatically — no configuration needed.
The same applies to: MySQL/MariaDB, PostgreSQL, Redis, MongoDB, Apache, PHP-FPM, Docker containers, and many others.
Basic Configuration
Netdata’s main configuration file is at /etc/netdata/netdata.conf. Most of the defaults are sensible for a single-node setup, but a few settings are worth reviewing.
bash
sudo /etc/netdata/edit-config netdata.confKey sections to know:
ini
[global]
    # How long to keep high-resolution (per-second) data
    history = 3600   # 1 hour in seconds (default)

[web]
    # Change the listening port if needed
    port = 19999
    # Bind to localhost only (recommended if using a reverse proxy)
    bind to = 127.0.0.1

[ml]
    # Enable ML-based anomaly detection (uses ~100MB additional RAM)
    enabled = yes
For the history setting: if you need longer local retention of per-second data, increase this value. For example, history = 86400 gives you 24 hours of per-second data. But note that Netdata also uses a tiered storage system — high-resolution data gets downsampled to per-minute, then per-hour, automatically over time.
Configuring Alerts
Netdata ships with over 400 pre-built alert definitions. They’re located in /etc/netdata/health.d/. You can view all active alerts from the dashboard under the Alerts tab.
Understanding the Default Alerts
A few important ones that ship out of the box:
ram_available— triggers when available RAM drops below 10%disk_space_usage— warns at 80%, critical at 90% disk usage per mount pointnet_drops— alerts on sustained network packet drops1min_cpu_iowait— high I/O wait on the CPUload_average_15— alerts when the 15-minute load average exceeds the number of CPU cores
Creating a Custom Alert
Let’s say you want an alert when CPU usage exceeds 80% for more than 2 minutes:
bash
sudo /etc/netdata/edit-config health.d/cpu_high.confyaml
alarm: cpu_usage_high
    on: system.cpu
lookup: average -2m unaligned of user,system
 units: %
 every: 30s
  warn: $this > 80
  crit: $this > 95
  info: CPU usage has been above $warn% for the last 2 minutes
    to: sysadmin
Save and reload:
bash
sudo systemctl reload netdataAlert Notification Channels
Netdata can send alerts to Slack, PagerDuty, email, Discord, Telegram, and others. Configuration is in /etc/netdata/health_alarm_notify.conf.
For Slack, find the relevant section and add your webhook URL:
bash
sudo /etc/netdata/edit-config health_alarm_notify.confini
SEND_SLACK="YES"
SLACK_WEBHOOK_URL="https://hooks.slack.com/services/YOUR/WEBHOOK/URL"
DEFAULT_RECIPIENT_SLACK="#your-alerts-channel"
Test it:
bash
sudo -u netdata /usr/libexec/netdata/plugins.d/alarm-notify.sh test slackNetdata Cloud: Centralized Monitoring Across Multiple Nodes
The local dashboard at port 19999 works fine for a single server. Once you’re managing multiple nodes — even just two or three — Netdata Cloud becomes the practical way to get a unified view.
Netdata Cloud is the SaaS layer on top of the open-source agent. The agents on your servers stream metrics to Netdata Cloud through an encrypted tunnel, but your data is processed locally first — Netdata Cloud receives a stream of already-computed metrics, not raw logs or data.
How to Connect a Node to Netdata Cloud
- Create a free account at app.netdata.cloud
- Create a Space (a workspace for your nodes) and a Room inside it
- Click Connect Nodes and you’ll get a one-line claim command that looks like this:
bash
sudo netdata-claim.sh -token=YOUR_CLAIM_TOKEN \
  -rooms=YOUR_ROOM_ID \
  -url=https://app.netdata.cloud
Run that on each server you want to monitor. The node appears in your Cloud dashboard within 30 seconds.
What Netdata Cloud Adds
Beyond the local dashboard, Netdata Cloud gives you:
- Overview tab — aggregate view across all nodes (top CPU consumers, memory usage, disk I/O, network)
- Nodes tab — side-by-side comparison of metric charts across nodes, synchronized time axis
- Alerts management — see all active alerts across your entire infrastructure in one place
- Anomaly Advisor — ML-driven tool that, when you select a time range where something went wrong, ranks all metrics by how anomalous they were during that window. This is genuinely useful for post-incident RCA on systems with dozens of correlated metrics.
- Metrics Correlations — identify which metrics changed together at a specific moment
- Role-based access control — add team members with viewer or admin roles per room
Pricing
The Community (free) tier covers unlimited nodes and users with a 90-day metrics history retention in the cloud. Paid tiers add longer retention, advanced alerting features, and dedicated support. For most small to mid-size infrastructure setups, the free tier is sufficient.
Monitoring a Specific Application: PostgreSQL Example
To illustrate how application monitoring works in Netdata, here’s the PostgreSQL integration — one of the most common database setups.
Netdata uses a plugin called go.d.plugin for database metrics. For PostgreSQL, it queries the pg_stat_* views via a local connection.
Step 1: Create a monitoring user in PostgreSQL
sql
CREATE USER netdata WITH PASSWORD 'your_password';
GRANT pg_monitor TO netdata;
Step 2: Configure the plugin
bash
sudo /etc/netdata/edit-config go.d/postgres.confyaml
jobs:
  - name: local
    dsn: "postgresql://netdata:your_password@localhost:5432/postgres"
Step 3: Restart the agent
bash
sudo systemctl restart netdataWithin a minute, your dashboard will have a new PostgreSQL section with charts for:
- Transactions per second (
postgres.db_transactions_rate) - Active connections vs max connections (
postgres.connections_utilization) - Cache hit ratio (
postgres.db_cache_io_ratio) - Lock wait times (
postgres.db_locks_held) - Table bloat and dead tuples (
postgres.table_n_dead_tup)
The cache hit ratio is worth setting an alert on — anything below 95% on a PostgreSQL instance with adequate RAM suggests index or configuration issues worth investigating.
Netdata Download: Other Installation Options
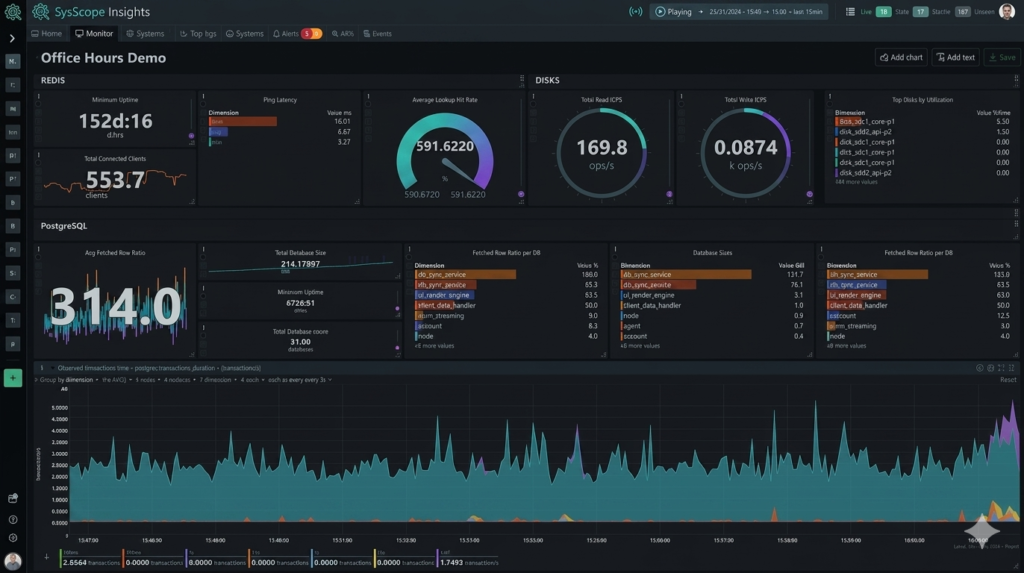
Download the Static Binary (Any Linux, No Package Manager)
For air-gapped environments or distros without package manager support:
bash
# Download the latest static build for x86_64
wget https://github.com/netdata/netdata/releases/latest/download/netdata-x86_64-linux.gz.run
chmod +x netdata-x86_64-linux.gz.run
sudo ./netdata-x86_64-linux.gz.run -- --dont-wait
Static builds are available for x86_64, ARMv7, and ARM64. Find all release assets at github.com/netdata/netdata/releases.
Kubernetes (Helm Chart)
bash
helm repo add netdata https://netdata.github.io/helmchart/
helm repo update

helm install netdata netdata/netdata \
  --set image.tag=stable \
  --namespace monitoring \
  --create-namespace
The Helm chart deploys a DaemonSet (one agent per node) and a parent pod that aggregates metrics. It automatically monitors kubelet, kube-proxy, coredns, the API server, and all running pods and services.
Performance Tuning for Production
Reduce Memory Usage
If RAM is a constraint, disable ML anomaly detection (which uses the most memory):
bash
sudo /etc/netdata/edit-config netdata.confini
[ml]
    enabled = no
Also consider reducing the retention period for high-frequency data:
ini
[global]
    history = 1800  # 30 minutes of per-second data instead of 1 hour
Control Which Plugins Run
If you don’t need monitoring for certain subsystems, disable their plugins in /etc/netdata/netdata.conf:
ini
[plugins]
    nfacct = no
    fping = no
    ioping = no
This reduces both CPU and the number of file descriptors Netdata holds open.
Limit CPU Usage
You can cap the agent’s CPU usage directly:
ini
[global]
    cpu utilization target = 2  # percent
Netdata will adjust its collection frequency automatically to stay under this target.
Conclusion
Netdata earns its place on Linux servers because it delivers genuine visibility with very little setup friction. Per-second metric collection catches the transient events — the 15-second CPU spike, the memory allocation burst, the brief network saturation — that 60-second polling completely misses. The auto-discovery of services means you’re not writing exporter configs and Grafana queries before you can see what’s happening.
The practical workflow most teams land on: install Netdata on every node via the kickstart script, connect nodes to Netdata Cloud for a unified view, add custom alerts for application-specific thresholds, and use the Anomaly Advisor as a first stop when incidents occur.
For teams already invested in a Prometheus stack, it’s worth running both — the setup cost is low and the two tools genuinely complement each other.